KPI CALCULATOR
Growing To Give
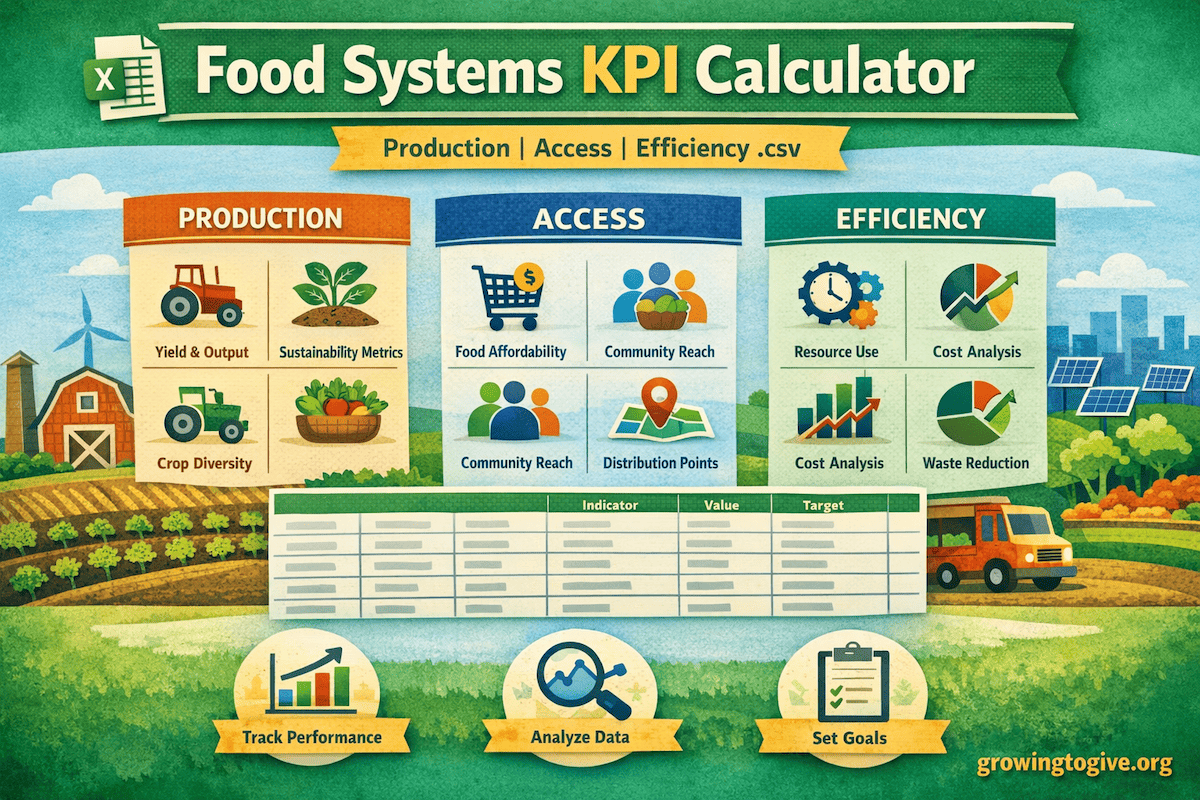
Use this plug‑and‑play tool to estimate Production & Yield KPIs, Food Access KPIs, and Water & Nutrient Efficiency KPIs for any food systems project.
EXPLORE
KPI CALCULATOR
Growing To Give
Use this plug‑and‑play tool to estimate Production & Yield KPIs, Food Access KPIs, and Water & Nutrient Efficiency KPIs for any food systems project.
EXPLORE
Food Systems • KPIs • Impact Measurement
Track the real impact of agricultural systems using key performance indicators (KPIs) that measure food production, resource efficiency, and community food access.
Quick answer: A Food Systems KPI Calculator measures crop production, yield density, food access, water efficiency, and nutrient efficiency to evaluate how effectively a farming system produces food and supports communities.
A Food Systems KPI Calculator is a data-driven tool used to evaluate the performance and impact of agricultural systems. By tracking key metrics, it helps organizations understand how much food is produced, how efficiently resources are used, and how many people can be supported.
Definition: Key Performance Indicators (KPIs) are measurable values used to assess how effectively a system achieves its goals—in this case, food production, access, and sustainability.
These metrics are essential for researchers, nonprofits, governments, and agricultural programs seeking to improve food security, optimize production systems, and demonstrate measurable outcomes for funding and reporting.
Did you know? Data-driven food systems can significantly increase efficiency—helping produce more food with fewer inputs while improving transparency for grants, investors, and community stakeholders.
As global challenges such as climate change, water scarcity, and food insecurity intensify, KPI-based tools like this calculator play a critical role in designing resilient, efficient, and scalable food systems.
Agricultural production alone does not fully capture the health of a food system. A productive farm may still fail to support community food access if distribution systems are weak or if food production relies on unsustainable resource use. Modern food system evaluation therefore requires a broader set of indicators that measure both production and resilience.
Food systems KPIs help quantify how farming systems contribute to community nutrition, economic stability, and environmental sustainability. These indicators provide valuable insights for policymakers, nonprofit organizations, and agricultural innovators who are working to strengthen food security and climate resilience.
In particular, food system metrics help answer important questions such as:
• How much food is produced per acre or per square foot?
• How many people can be fed by a given farming system?
• How efficiently are water and nutrients used?
• How resilient is the system to climate variability?
By measuring these indicators consistently, agricultural programs can track progress, identify inefficiencies, and design systems that produce more food while using fewer resources.
• Enter your growing area and choose the unit (sq ft, acres, sq meters, or hectares).
• Enter pounds produced per season (or per year if you switch the dropdown)
• Open Food Access to estimate servings, households reached, and individuals served.
• Open Water & Nutrients to report water/fertilizer per pound and optional reductions vs baseline.
• Click Download CSV to export your KPIs for reporting.
| Total fresh produce grown | — |
|---|---|
| Pounds per season | — |
| Pounds per year | — |
| Yield per sq ft | — |
| Yield per acre | — |
| Crop cycles per year | — |
| Yield density multiple (optional) | — |
| Yield consistency (optional) | — |
| Servings distributed (est.) | — |
| Households reached (est.) | — |
| Individuals reached (est.) | — |
| Individuals served per distribution (est.) | — |
| Water per pound (est.) | — |
| Water reduction vs baseline (optional) | — |
| Fertilizer per pound (est.) | — |
| Fertilizer reduction vs baseline (optional) | — |
Production metrics form the foundation of food system analysis. These indicators measure the amount of food generated by agricultural systems and the efficiency with which land is used. Yield density, crop cycles, and harvest consistency are key indicators used to compare farming systems and evaluate improvements in productivity.
Yield density measures the amount of food produced relative to the land area used. Systems with higher yield density often rely on improved soil health, crop diversification, and efficient irrigation practices. Many regenerative farming systems improve yield density by increasing soil fertility and biological activity.
Crop cycles represent the number of harvests produced during a year. Regions with long growing seasons or controlled environments may produce multiple crop cycles, significantly increasing total food output per acre.
Food production alone does not guarantee food security. Access metrics help determine how agricultural production translates into real-world nutrition for communities. By estimating servings produced and households reached, these indicators show how farming systems contribute to feeding local populations.
Community gardens, urban agriculture programs, and regional food initiatives frequently use these metrics to evaluate their impact. Estimating servings produced allows organizations to demonstrate how their programs contribute to reducing food insecurity and improving access to fresh produce.
Household impact metrics are especially valuable for nonprofit organizations working to strengthen food systems in underserved regions. These indicators help translate agricultural production into measurable social outcomes.
Agriculture consumes significant amounts of water and nutrients. Measuring resource efficiency is therefore critical for designing sustainable food systems. Efficiency metrics track how effectively water and fertilizer inputs are converted into food production.
Water efficiency metrics estimate the relationship between water usage and crop output. Farming systems that conserve water through practices such as mulching, drip irrigation, and rainwater harvesting can significantly increase production per unit of water used.
Nutrient efficiency metrics measure how effectively soil fertility inputs are converted into crop yields. Healthy soil biology improves nutrient cycling and reduces the need for synthetic fertilizers, helping farmers maintain productivity while reducing environmental impact.
Food system metrics are increasingly used in agricultural planning, development programs, and climate adaptation strategies. Governments and research institutions rely on measurable indicators to design food security initiatives and evaluate agricultural investments.
Nonprofit organizations and community food programs also use these indicators to track the success of their projects. Measuring food production, community reach, and resource efficiency allows organizations to demonstrate their impact and improve program design over time.
Data-driven agricultural planning is particularly important as climate change introduces greater uncertainty into global food systems. By measuring key performance indicators, agricultural programs can identify practices that improve resilience and maintain food production under changing environmental conditions.
Many agricultural grants and food security initiatives require measurable performance indicators to evaluate program outcomes. Food system KPIs provide a standardized framework for measuring agricultural productivity, community food access, and resource efficiency.
Organizations applying for grants often need to estimate the expected impact of their programs before funding is awarded. Tools like this calculator allow project planners to estimate how many pounds of food may be produced, how many servings could be generated, and how many households could benefit from improved food production systems.
These indicators help funders evaluate whether agricultural initiatives are capable of delivering meaningful results. Programs that demonstrate strong production efficiency and measurable community impact are more likely to secure funding and long-term support.
Once projects are implemented, the same indicators can be used for monitoring and reporting outcomes. This allows organizations to document progress and demonstrate how their work contributes to improved food security and sustainable agricultural development.
In an era of increasing demand for transparency and accountability in public funding, reliable food system metrics are essential for demonstrating impact and scaling successful agricultural models.
Food system impact is often measured using a set of key performance indicators (KPIs) that help farmers, nonprofits, and researchers evaluate how effectively land, water, and nutrients are being used to produce food. The metrics below explain the indicators used in this calculator and why they are important for understanding agricultural productivity and food access.
Yield density measures how much food is produced within a specific growing area. Instead of simply measuring total harvest, yield density evaluates how efficiently land is used to produce crops. High yield density systems can produce more food per square foot or acre, which is especially important for small farms, urban agriculture, and intensive growing systems such as regenerative gardens and community farms.
Servings produced estimate how many individual meals or food portions can be generated from a harvest. Translating crop yields into servings helps organizations communicate the real-world impact of agricultural programs, particularly when measuring food security outcomes and community nutrition benefits.
Households fed estimates the number of families that can be supported by a given food production system. This metric helps nonprofits, policymakers, and community agriculture programs demonstrate the impact of their projects in terms that are meaningful for food access and hunger reduction initiatives.
Water efficiency measures how effectively irrigation water is used to produce crops. In many regions facing water scarcity, improving water efficiency is critical for maintaining agricultural productivity while conserving limited water resources. Techniques such as drip irrigation, mulching, and rainwater harvesting techniques can significantly improve water efficiency in farming systems.
Nutrient efficiency evaluates how effectively fertilizers and soil nutrients are converted into plant growth and food production. Healthy soils with strong biological activity, compost inputs, and regenerative practices such as worm castings and organic soil amendments often improve nutrient efficiency while reducing the need for synthetic fertilizers.
| Metric | What It Measures |
|---|---|
| Yield Density | Amount of food produced per area of land |
| Servings Produced | Total number of food servings generated from harvest |
| Households Fed | Estimated number of families supported by food production |
| Water Efficiency | How effectively irrigation water produces crop yield |
| Nutrient Efficiency | How effectively soil nutrients and fertilizers convert to plant growth |
A food systems KPI (Key Performance Indicator) is a measurable metric used to evaluate the performance of agricultural and food production systems. Common indicators include crop yield, food production density, servings produced, households reached, and resource efficiency such as water and nutrient use.
Food system metrics help farmers, researchers, and organizations measure the effectiveness of agricultural programs. These indicators provide insights into food production, community access to food, and sustainability outcomes, helping guide better agricultural planning and policy decisions.
Many agricultural and food security grants require measurable outcomes. Food system KPIs allow organizations to estimate and report metrics such as pounds of food produced, servings generated, households served, and improvements in water or nutrient efficiency. These indicators help funders evaluate the impact of agricultural programs.
This calculator estimates several key indicators including food production, yield density, crop cycles, food servings produced, households reached, water efficiency, and nutrient efficiency. These metrics help evaluate both the productivity and sustainability of farming systems.
The calculator can be used by farmers, nonprofit organizations, food security programs, researchers, and policymakers. It is particularly useful for community agriculture initiatives, regenerative farming projects, and grant-funded food production programs seeking to measure impact.
.png)
.png)
.png)

.png)
Copyright Ⓡ 2026. All Rights Reserved. Growing To Give